Why is it in the news?
1. The international monetary fund recently projected that India will ease past Japan to become the world's fourth largest economy by the end of 2025. Thus, the size of the Indian Economy would be $4.19 trillion. The other biggest economies are the USA ($28 trillion), China ($18 trillion) and Germany ($4.5 trillion). India is poised to achieve a GDP of $5 trillion in 2027 and $10 trillion by 2035. This is a remarkable achievement for a country that began its journey as an independent nation in 1947 with the meagre $33 billion economy.
2. Although absolute GDP figures are useful for understanding the size of an economy, yet they do not point out as to how wealth is distributed, how developed a country is and how much its citizens are enjoying the lives of prosperity ? Thus, it masks cost of living, income inequality and disparities in population size. A country may have a large economy but that does not necessarily translate into prosperity or improved living standards of its people.

What is Gross Domestic Product?
1. GDP is the total monetary value of all final goods and services produced within a country’s borders over a specific period of time, say one year. It measures the economic activity of a nation, including consumption, investment, government spending and net exports. Thus, GDP measures production within a country’s borders regardless of who produces it. It includes the total value of production without accounting for depreciation. Again it excludes income earned by residents abroad or income paid to foreigners.
2. On the other hand national income/net national income focuses on production by country’s residents, whether inside or outside the country including income from abroad. It subtract depreciation from GDP to reflect the net value of production. It includes net foreign income i.e. income earned abroad minus income paid to foreigners. For example, if a country has a GDP of one trillion dollars and depreciation of $150 billion and net foreign income $100 billion. Thus, NNP/National Income would be one trillion dollars - $150 billion + $100 billion = $950 billion.
3. GDP can be calculated using three approaches : - Production, Income and Expenditure. The production approach or value added approach to measure GDP calculates the total value of goods and services. Thus GDP = (Gross value added) +Taxes on products - Subsidies on products.
Where : Gross value added (GVA) = Value of output - Intermediate consumption for each sector which is the cost of raw materials and services used in the production process. Thus, this approach ensures that only the value added at each production stage is counted, avoiding double counting of intermediate goods. In this process, the economy is divided into various sectors and then gross value added is calculated at each stage of production and then taxes like sales tax and GST are added. The sum total of products - subsidies on the products given by the Government is the Gross GDP.
4. The income approach to measure GDP calculates the total income earned by individuals and businesses in an economy from the production of goods and services. Its sums up all income generated in the production process, such as wages, profits and rents. According to this approach GDP = Compensation of employees + Gross operating surplus + Gross mixed income + taxes on production and imports - subsidies.
Where : (A) Compensation of employees means total wages, salaries and benefits paid to workers including social contribution like pension, health insurance.
(B) Gross operating surplus means profit earned by businesses, including corporate profits, depreciation (capital consumption) and net interests.
(C) Gross mixed income means income earned by self employed individuals and unincorporated businesses or informal sector, combining wages and profits.
(D) Taxes on production and imports means indirect taxes like sales tax or GST imposed on production and imports.
(E) Subsidies means Government payment to producers to lower the cost of production.
Thus, this formula captures the total income earned by all factors of production like labour, capital and entrepreneurship within the country.
5. The expenditure approach to measure GDP calculates the total value of all goods and final services produced within a country by summing the expenditures made by different sectors of the economy. The formula is GDP = C + I + G + (X-M) where
(A) C (consumption) means total spendings by households on final goods and services such as food, clothing and healthcare.
(B) I (investment) means expenditure by businesses on capital goods like machinery, buildings, inventories and residential investments by households.
(C) G (Government spending) means expenditures by the government on goods and services such as infrastructure, defence and public services excluding transfer payments like pensions or interests.
(D) X (exports) the value of goods and services produced domestically and sold abroad.
(E) M (imports) means the value of goods and services purchased from abroad. Thus, imports are subtracted from exports to avoid counting of foreign production, giving net exports of a country.
Thus, the expenditure approach focuses on the demand side of the economy. It ensures that only final goods and services are counted, avoiding double counting of intermediate goods.
Limitations of GDP
1. GDP measures total economic output but does not reflect how income or wealth is distributed. For example, a country with high GDP may still have significant poverty or inequality among its population. Thus, It is estimated that India’s absolute GDP has risen from $468.4 billion in 2000 to $1487 billion in 2025, surpassing Japan’s GDP. However, India’s GDP per capita is 12 times lower than that of Japan’s in 2025. [Source: The Hindu].
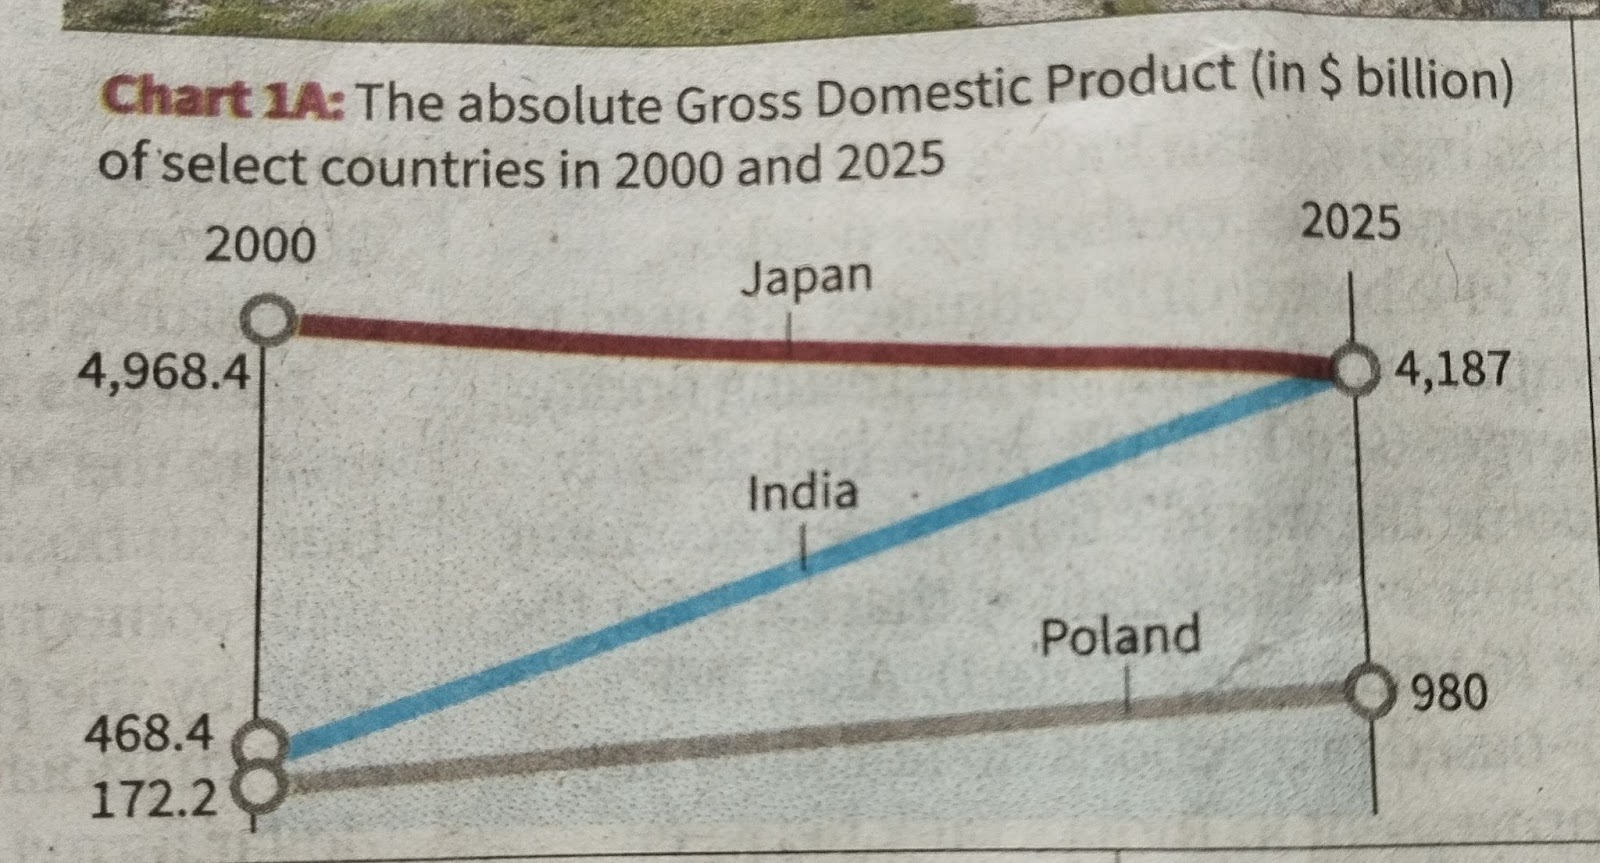
Similarly, the above chart also shows that while the total GDP of Poland is around 4 times smaller than that of India but its GDP per capita is 9 times greater than that of India.
2. GDP does not capture non economic factors like health, education, life expectancy or happiness. Thus, a country may have high GDP but poor living conditions or low social welfare. Thus, in India, the gross enrollment rate in college education after completion of secondary school was 32.7% in 2022 compared to 65% in Japan and 75% in Poland.

Similarly, GDP of a country does not reflect adequate healthcare infrastructure. For example, in India, the infant mortality rate in 2022–23 was 28 deaths per 1,000 live births and the maternal mortality ratio was 97 deaths per 100,000 live births, which was significantly higher compared to Japan (IMR: 1.7, MMR: 5), South Korea (IMR: 2.6, MMR: 11), and China (IMR: 5.0, MMR: 16). On the health front, the life expectancy of a person was 72 years for an average Indian in 2023, compared to 84 years in Japan, 78.5 years for Poland, 78.2 years in China, 83.6 years in South Korea, 77.5 years in the US, and 80.7 years in the UK.
3. GDP also does not take into account the employment opportunities to the people. For example, the share of wage and salaried workers from regular employment in India was just 23.9% in 2022 against 91% in Japan and 80.1% in Poland .
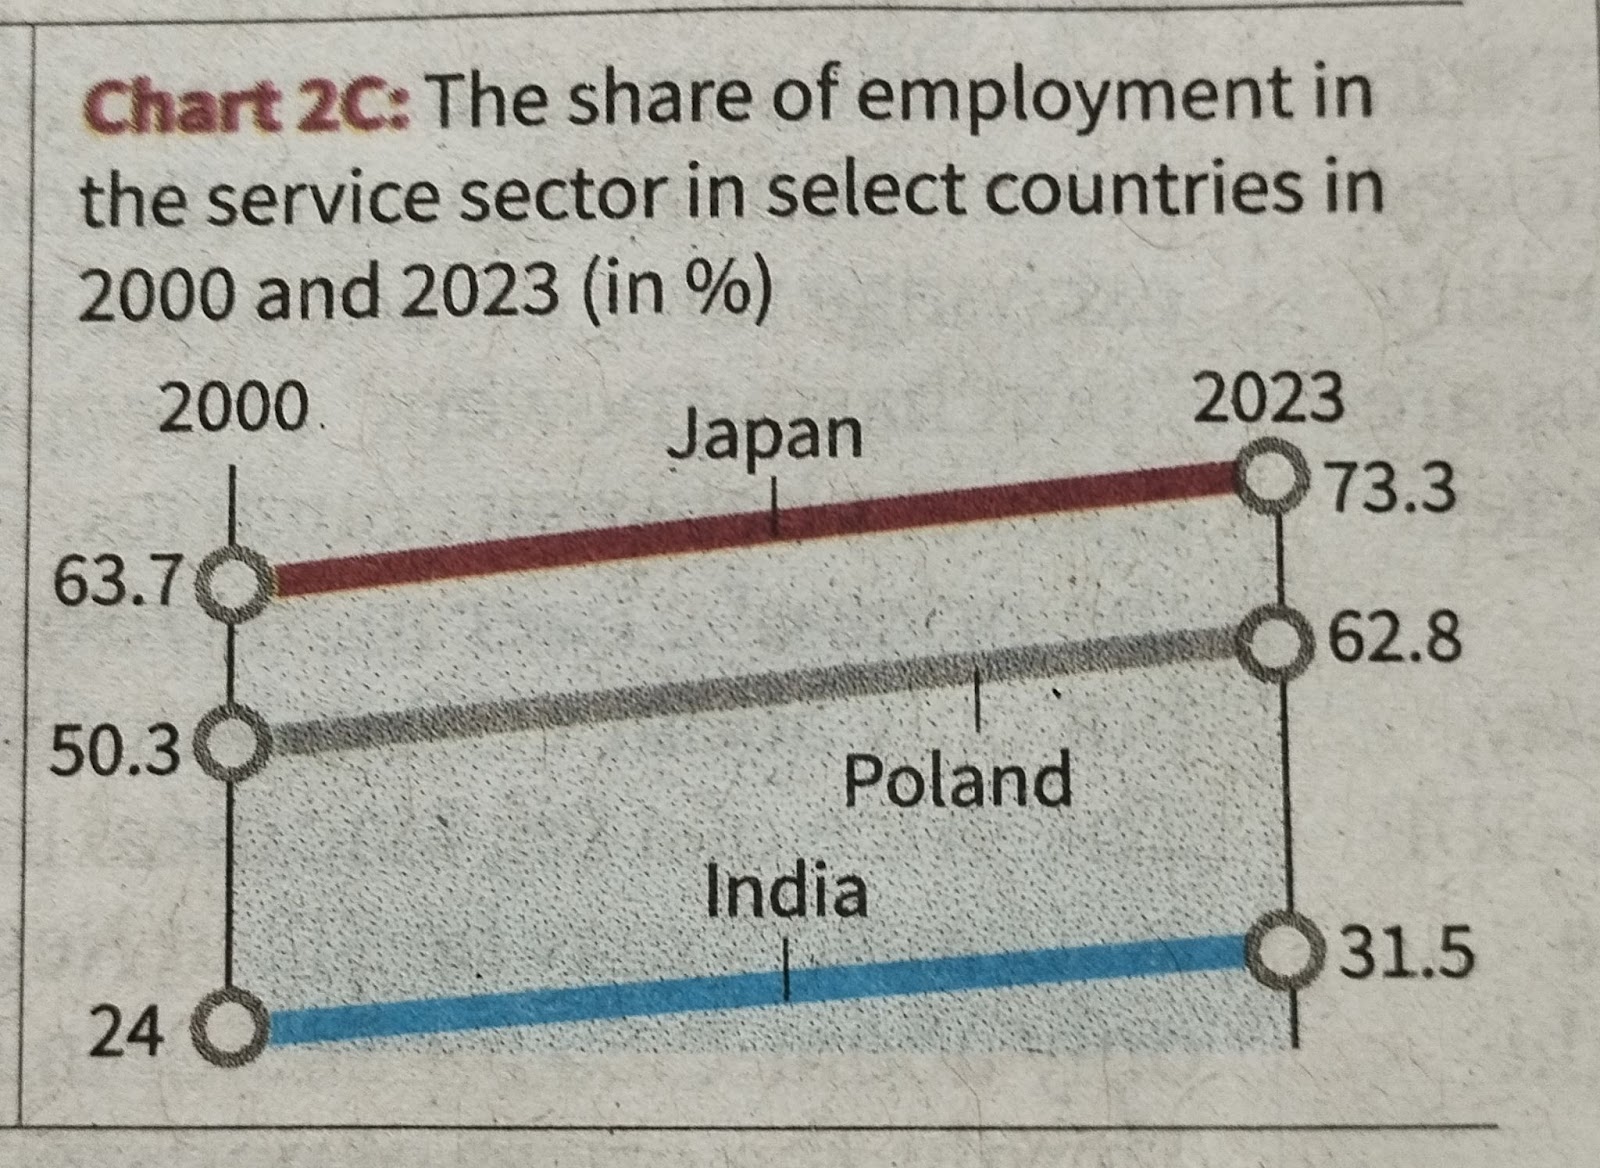
4. The GDP also does not take into account the sectoral distribution of workforce and changes therein for example nearly 45% of the workforce in India is employed in agriculture compared to Japan where less than 10% people are employed in agriculture. In 2023, the share of employment in the service sector in India was 31.5% while for Japan it was 73.3% and for Poland it was 62.8%.
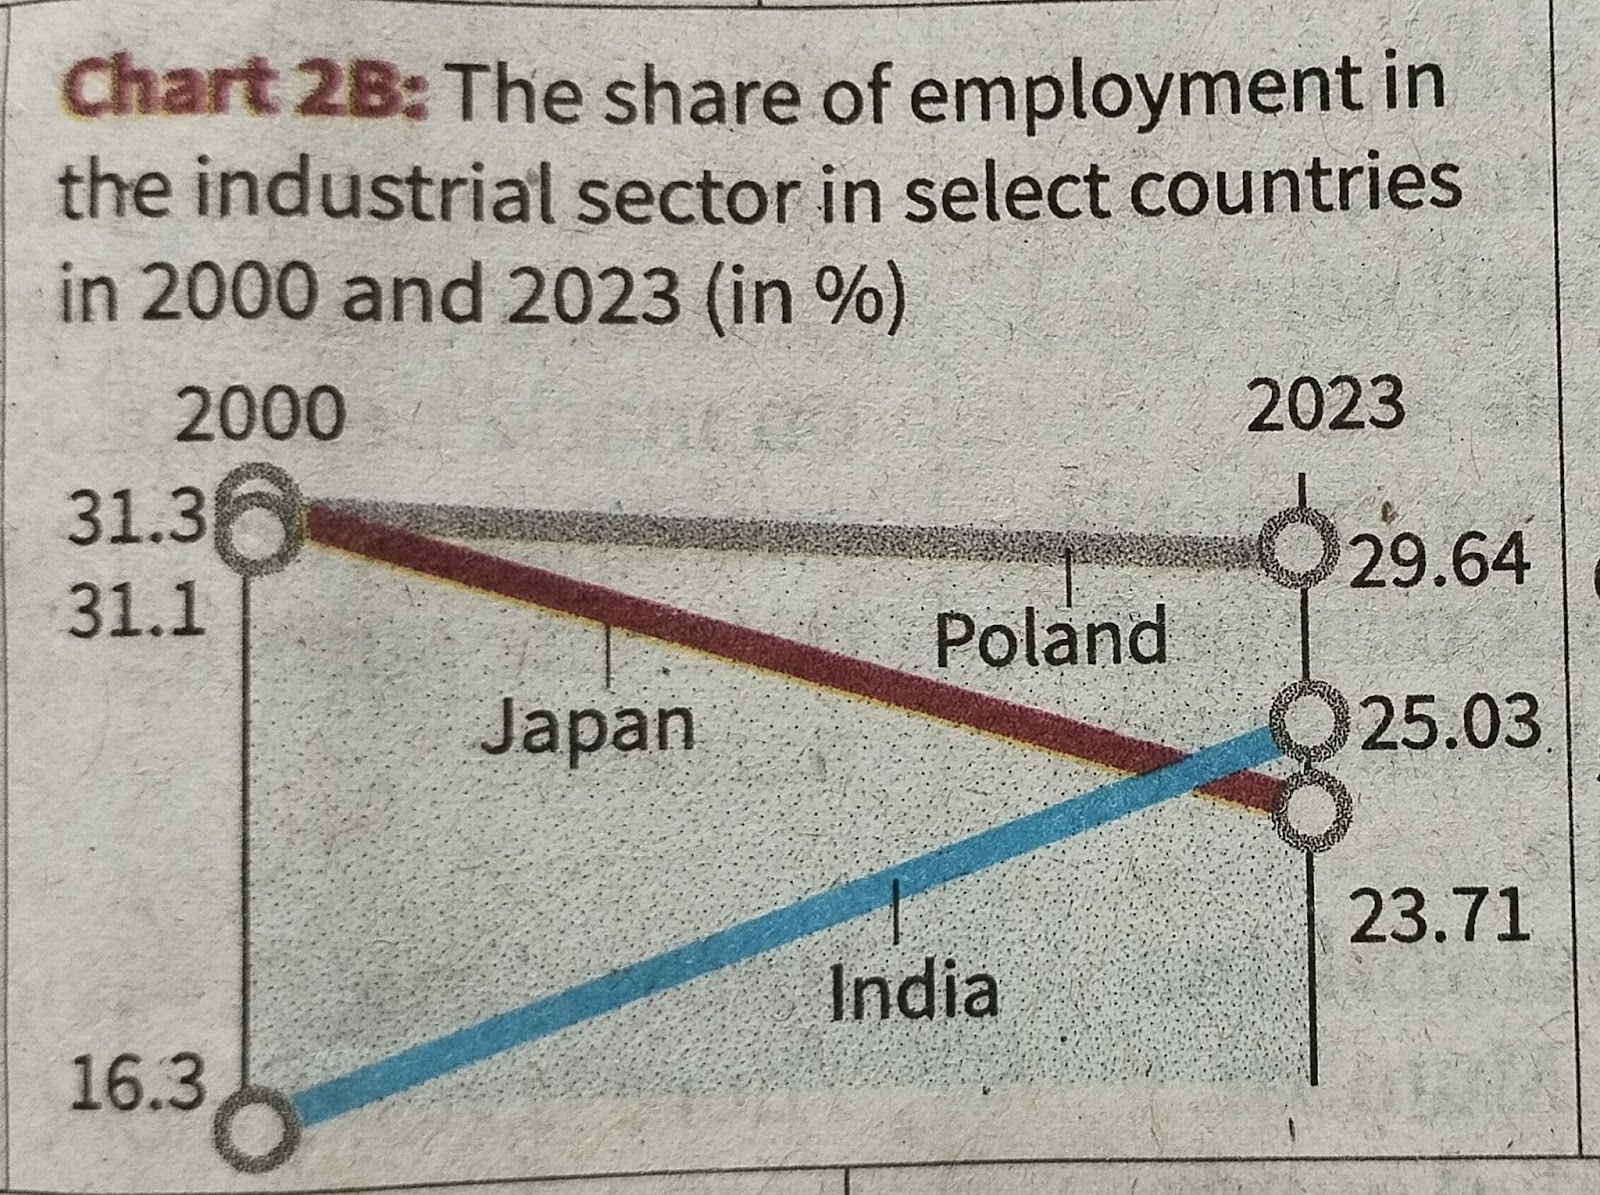
In the Industrial sector, India witnessed a rise of 25.03% employment in 2023 from 16.3% in 2000 compared to Japan which slipped from 31.1% (2000) to 23.71%, indicating a shrinking of its economy.
Thus, a country may have high GDP but may suffer from poor living conditions.
5. GDP also does not take into account non market activities like household work or voluntary services.
6. It also does not take into account environmental degradation or resource depletion. A country may boost up its GDP growth by proliferation of timber factories or opening of big industries. These activities may cause deforestation or pollution in the long run. This will ultimately cause irreparable damage to the economy.
7. GDP does not take into account the depreciation of the capital assets. It only talks about gross investment. It also does not take into account the quality of life.
8. GDP also takes into account the regional variation within the country while some areas may be economically very strong while others are lagging far behind. For example, the per capita income of Goa is ten times greater than that of Bihar.
9. GDP focuses solely on the quantity of goods and services produced without taking into account quality, innovation or efficiency.
10. It emphasises current production and consumption without considering long term consequences such as debt accumulation or unsustainable growth patterns. For example, India had debt burden of ₹55 lakh crore in 2014 which increased to ₹181 lakh crore in 2024
Alternative methods of calculating the economy performance and social progress
While GDP is a useful indicator of economic activity, it falls short in measuring overall social progress, environmental sustainability and equitable distribution of wealth. That’s why, alternative methods to measure the economy of a country have been invented. These are genuine progress indicators, human development index, gross national income, net national income, inclusive wealth index and multidimensional poverty index.
A) Gross Progress Indicator (GPI) = GDP + Value of Non market activities - cost of negative externalities like environmental degradation. However, it is very difficult to objectively assess environmental and social costs.
B) Gross National Income - It is derived by adding GDP with net income from abroad. On the other hand net national income = gross national income - depreciation. However, net national income also suffers from limitations because it does not take into account non-market activities and environmental degradation.
C) Inclusive wealth index = value of produced capital (infrastructure) + human capital (education and skill) + natural capital (resources and ecosystems). The above index also suffers from the exact valuation of intangible assets like human and natural capital.
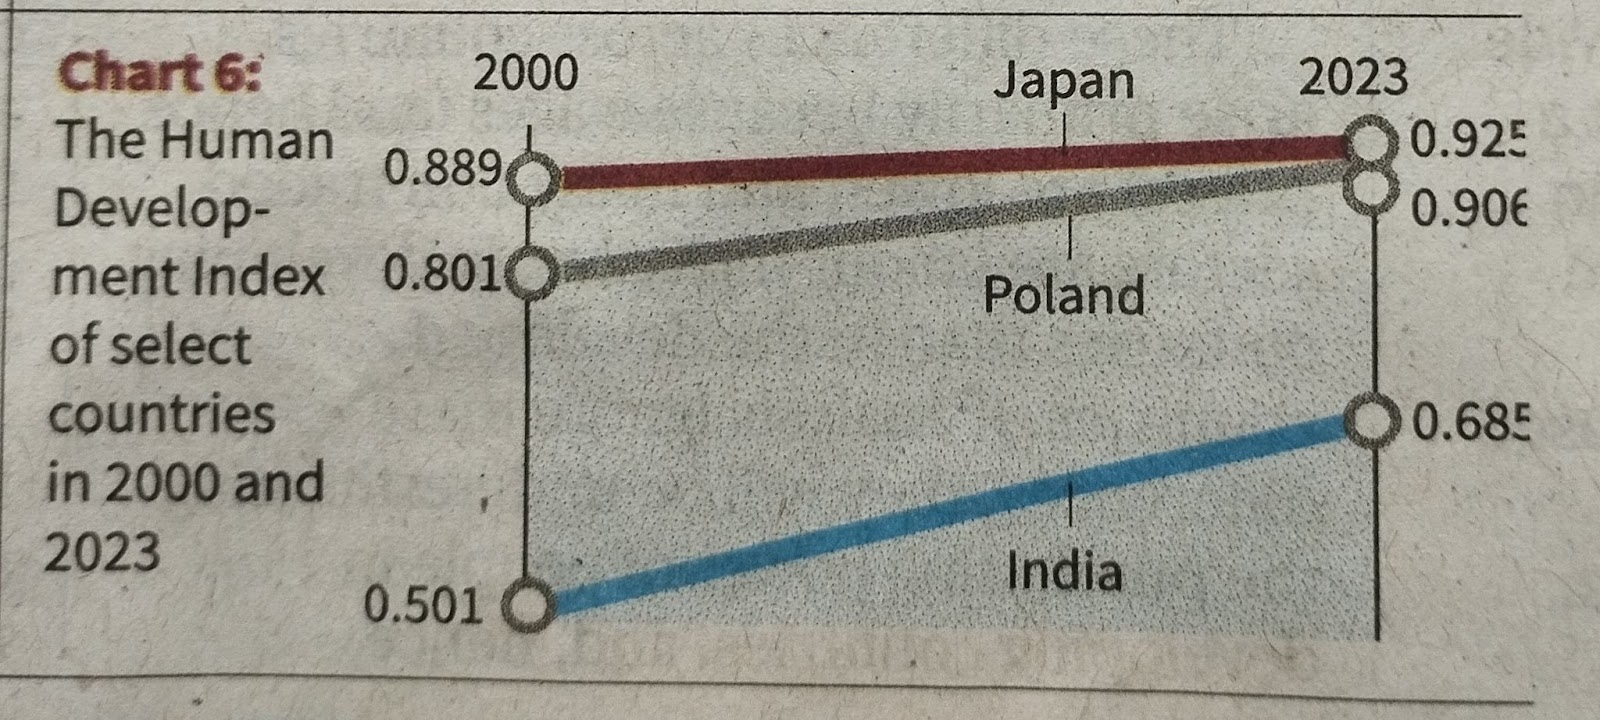
D) Human Development Index is derived by taking into three dimensions like life expectancy (health), education (mean and expected years of schooling) and standard of living (Gross national income per capita adjusted for purchasing power parity) HDI is derived by 3life expectancy index * education index * income index . The HDI is derived in the scale of 0-1 in the ascending order. The developed countries have HDI more than 8.5. HDI of India is 0.685 in 2023 as per the UNDP calculation, putting it in the middle income category and developing status. While HDI of Japan and Poland crossed 0.9 mark, putting it to very high human development.
However, HDI does not take into account inequality, environmental degradation or happiness of the people.
Conclusion
1. To improve the human development index of India (HDI = 0.685) to make it at par with China (0.788), Japan (0.925) and South Korea (0.929) in 1923, it is imperative to make significant improvement in three core dimensions of health, education and standard of living. India must strive for universal health insurance for all Indians by strengthening the 100% coverage to its population, increasing healthcare spending from the present 2% of GDP to 6% aligning with China (6%), Japan (10%), South Korea (8%). These measures would enhance the life expectancy in India by 3-5 years by 2030.
2. India must strive for expanding the mid-day meal scheme to combat malnutrition among children. Focus should be upon clean water and sanitation to reduce water borne diseases. These diseases lead to 20% infant mortality.
3. There must be priorities to improve upon the health facilities in underdeveloped states like UP, Bihar, Jharkhand, Chhattisgarh, Madhya Pradesh.
4. Mean years of schooling is 6.9 years and expected years of schooling is 13 years in India compared to MYS in China 8.2 and EYS 14.3. In Japan MYS is 12.8 years and EYS is 15.2 years. In order to bridge the gap, India must raise education spending from 4% of GDP to 6%. It must ensure universalisation in secondary education, especially for girls and rural students. There is a need to increase the building of more schools in remote areas. India must improve education quality by incentivising teachers training. An effort should be made for gender and regional equity.
5. India must raise standard of living by increasing the gross national income per capita from the present $9046 in 2023 to at least $15000 by 2030 to catch up with China ($20013), Japan ($41010) and South Korea ($45560). In order to bridge the gap, India must strive for rapid industrialisation and export led growth in electronics and value added goods. The contribution of the manufacturing sector (at present 16%of GDP) must be increased to 28% of GDP by 2030. The manufacturing and construction sectors have huge capacity to absorb unemployed or underemployed youths in agriculture.
6. India must strive to bridge the gap between the urban and rural economic development. It must invest in rural infrastructure like roads, electricity, irrigation and farming. Schemes like MGNREGA should be further expanded with higher wages and skilling of workers. More efforts should be made to promote financial inclusion, these efforts may lead to doubling of rural incomes, thereby enhancing gross national income per capita to $15000 by 2030.
7. India must strive for reducing income inequality by progressive taxation and increasing minimum wages and providing social security to workers. Implementing a wealth tax of 2% on billionaires would be helpful in raising the standard of living of below 20% of the population by providing them with durable assets like affordable housing and gainful employment.
8. To sum up, India can enhance its HDI to at par with China by 2030 through universal healthcare, better nutrition and sanitation and clean water, enhancing the enrolment in primary and secondary education, gender equity and boosting industrial growth, job creation or employment opportunities and reduction in inequality. More emphasis should be on research and development, artificial intelligence, robotics, space, defence production, quantum technology and crypto and bio engineering to reap the maximum benefits so that gross national income per capita is further enhanced. This will increase the standard of living of the people, thereby, increasing the human development index of India at par with China by 2030.


No comments:
Post a Comment