Introduction
1.Before independence, the foreign trade of India was basically colonial in nature to subserve the mother country, Great Britain. India exported raw materials and food items to Britain and imported manufactured goods from Britain. This resulted in a severe blow to the indigenous handicrafts in India.
2. After independence, India embarked upon the path of development and industrialisation. Hence, it had to import capital goods like machinery, equipment for setting up steel plants, locomotive factories, hydroelectric projects, Secondly, India had to import consumer goods like food grain, jute, cotton on account of the partition in order to arrest the rise of prices of those items. Because of the increasing volume of imports, the balance of trade went against India because imports exceed exports.

Pattern of imports
1.The rise in imports was due to the demands of capital goods like machinery and equipment for the industrialisation of our country. Secondly, growing imports has been due to the liberalisation policy adopted by the government of India since 1991. Thirdly, the declining imports of food grains and consumer goods was on account of India becoming self-sufficient in food production because of the Green Revolution and industrial growth. Fourthly, the volume of imports grew on account of sharp rise in international prices of petroleum products and fast increase in domestic demand. For example, from 69 crores in 1960-61, the import bill of POL increased to 10 lakhs crores in 2013-14. Similarly, the growth in agriculture demanded heavy use of fertilisers and so, the import bill of the fertilisers increased from 13 crores in 1960-61 to 38 thousand crores. The import of metals like iron and steel and non ferrous metals increased from a paltry 54 crores in the first plan to 2 lakhs 75 thousand crores in 2013-14, necessitated by the programmes of industrial expansion, development of railways and hydroelectric projects. Similarly, imports of chemicals, drugs and medicines increased from 39 crore in 1960-61 to 40 thousand crores in 2013-2014.
To Watch Full Video, Click on this link
2.Because of the rising demand of the affluent sections of our population the import of pearls and precious stones increased manifolds. Import of capital goods like machinery, electrical, non-electrical equipment, and computers increased from 356 crores in 1960-61 to 4 lakh 84 thousand crores in 2013-14.
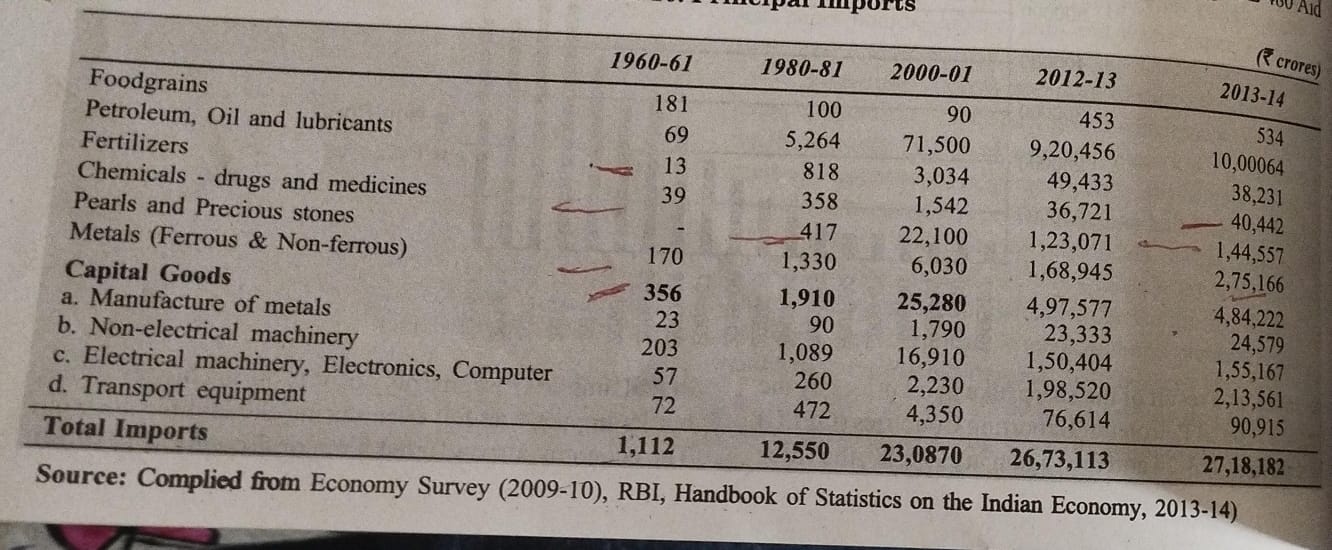
3.As of 2023, Indian imports includes petroleum products, gold, diamond, coal and other gaseous hydrocarbons. At the time of independence, the composition of India’s imports included oils, pulses, machinery, chemical, hardware, pharmaceuticals, dyes, yarns, paper, grains, non-ferrous metals, cars and capital goods like non electrical and electrical machinery and metals. India is heavily dependent on raw materials like active pharmaceutical ingredients (API), organic chemicals, iron and steel. The composition of import has undergone a shift away from raw materials to intermediate and capital goods over the last two decades. The total merchandise imports witnessed a growth of more than 26 times during 1991 to 2019. The imports have increased at a higher rate than the exports during the same period. Higher import has been necessitated because of the accelerated infrastructure build up and to boost manufacturing exports.
Pattern of exports
1.There has been a continuous decline of the exports of agricultural raw materials and allied products because of the increase in the population and consequent increase in domestic consumption and so there has not been a perceptible surplus in many traditional commodities like tea or food grains. However, since the 1960s, export of fish and fish products, cashew kernel, coffee, rice, vegetables and fruits increased manifold. Similarly, on account of industrialization, the export of engineering goods, handicrafts, iron and steel, machinery, metal manufactures, iron ore, chemicals, readymade garments, jewellery, semi precious stones increased manifold. (see the table pic 3) and these goods constitute about 70% of India's exports now. India has also seen a sharp jump in the export of electronic goods and software because of the growing information technology industries in Bengaluru and Hyderabad. Traditional items like cotton fabrics, tea, leather and leather manufactures are also growing and expanding.
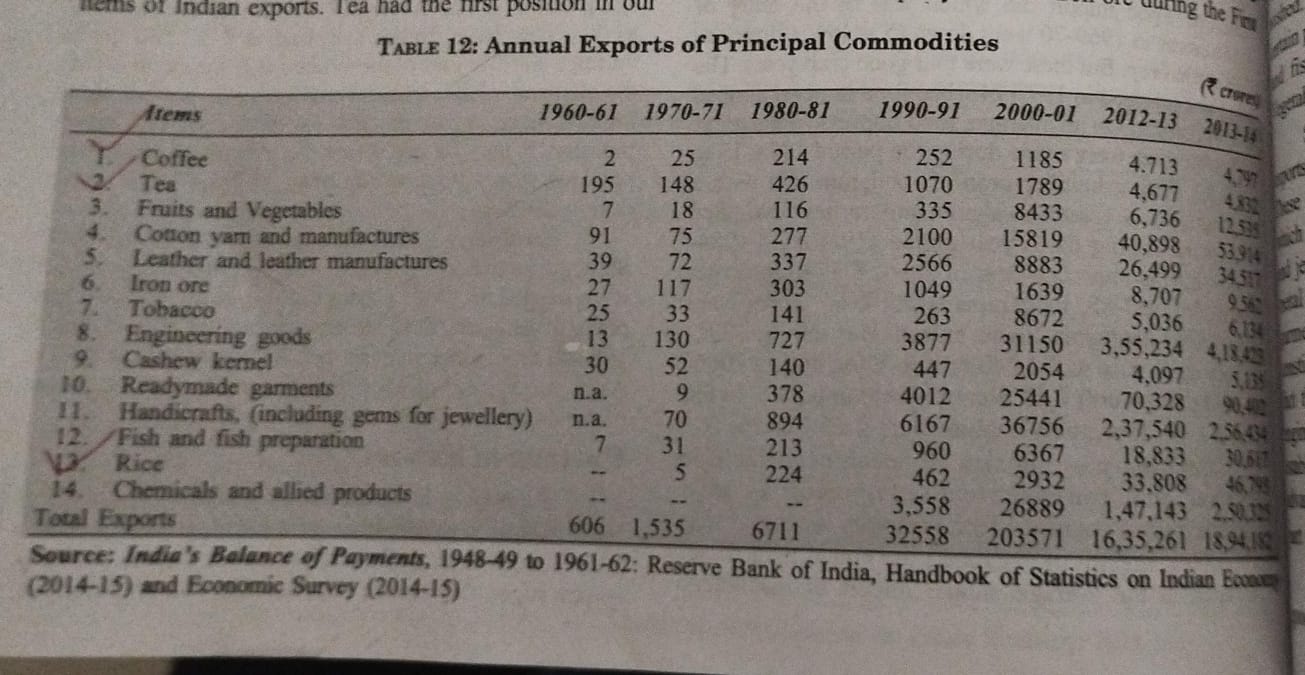
2.Thus, both traditional and non-traditional items are being exported by India. This is the sign of a diversified economy. The large expansion of engineering goods and its exports is due to the fact that it has become viable and competitive in the international market. India is also the exporter of engineering goods to middle east countries because these countries have undertaken infrastructure development recently.
3.India is now in a position to compete in the international market and its products are very much appreciated by the people worldwide. High quality of engineering goods, readymade clothes and handicrafts have high potential for the growth of exports. From an importer of food items, India has become a major exporter of rice. However, India is facing stiff competition from China in the export of iron and steel. Moreover, the import of iron and steel is indicative of under utilisation of steel plants. The exporting of iron ore further shows that India is not in the position to produce iron and steel to the maximum for want of capital and competitiveness from China and other advanced countries of the world.
4.The composition of exports has undergone structural changes. The percentage share of non-traditional goods like engineering goods, sugar, chemicals, pharmaceuticals, electrical goods, iron and steel, leather goods, gems, jewellery, sports goods, toys, projects goods have increased. In addition, exports of the traditional products like coffee, tea, jute, iron ore, animal skin,cotton, minerals, fish and fish products have also increased manifold.
Direction of India’s foreign trade
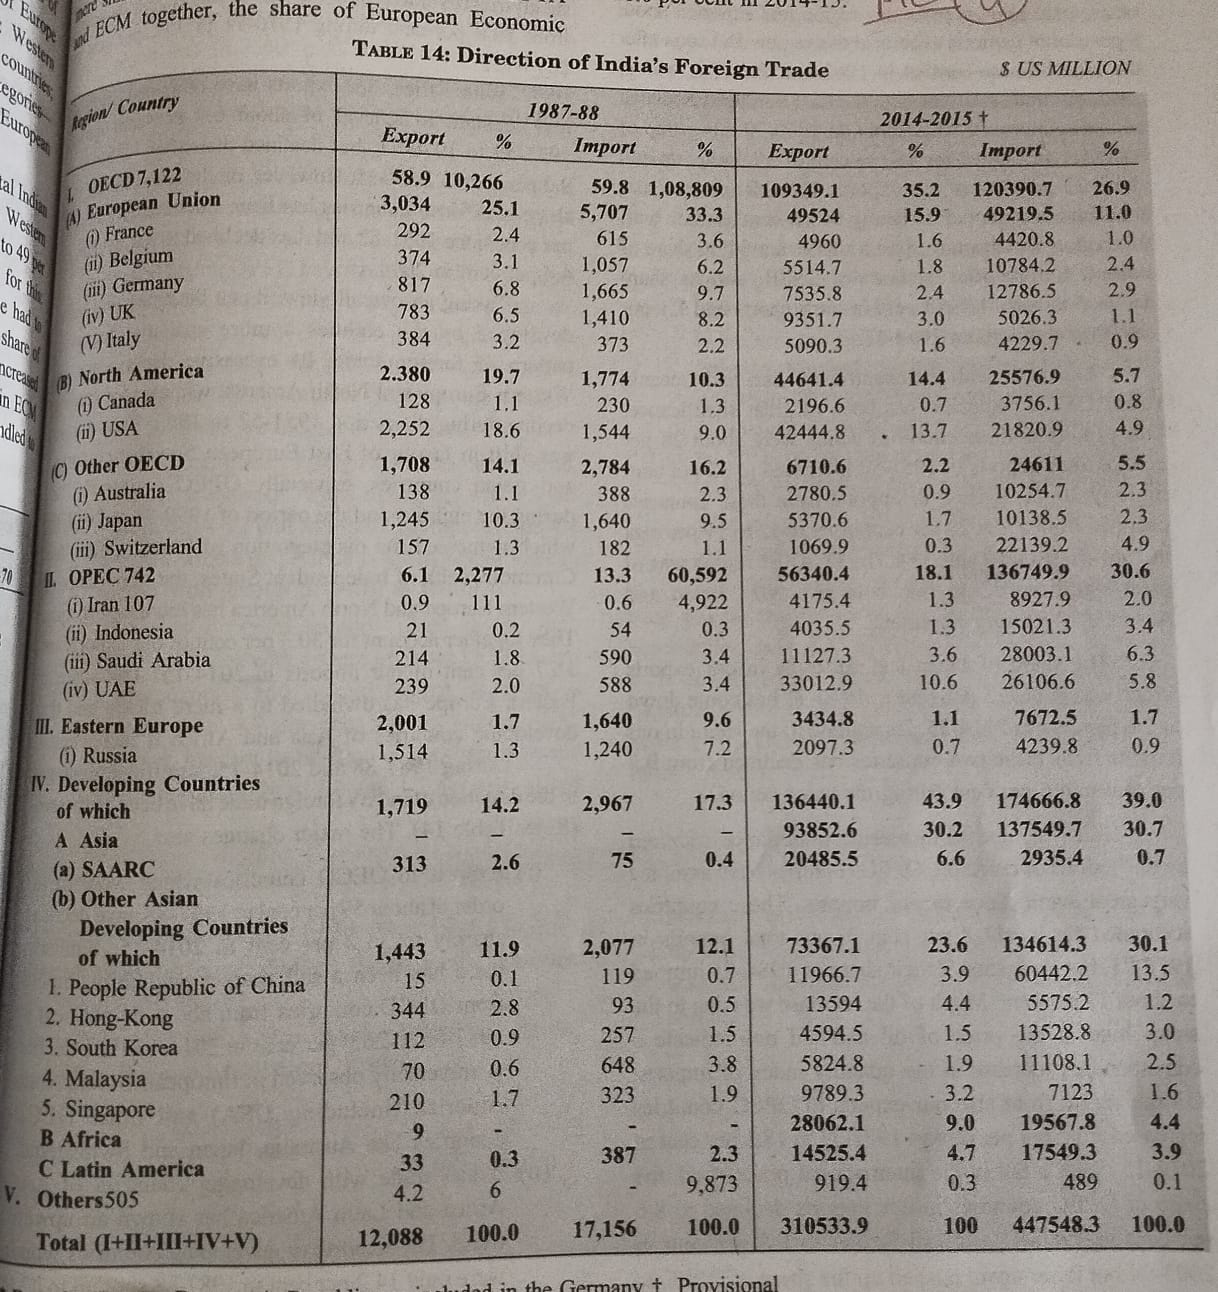
1.Exports to and imports from OECD (Organisation for Economic Cooperation and Development) countries have declined in the last 30 years. The volume of export was 59% in 1987-88 which sharply decreased to 35.2% in 2014-15. Similarly, the volume of import was 60% in 1987-88 which came down to 26.9% in 2014-15. Thus, India was able to lower its excessive dependence upon advanced countries of OECD.
2.India’s trade with developing countries with Asia, Africa and Latin America has shown an upward trend, the exports to developing countries which were only 14.2% in 1987-1988 shot up to 43.9% in 2014-15. Export to countries of Asia improved from 12 % to 30.2% during this period. China and Hong Kong shared about 8.3% of our exports. Imports from developing countries have risen from 17.3% in 1987-88 to 39% in 2014-15. Import from China and Hong Kong further increased to 14.7% in 2014-15. Export to OPEC countries increased from 6.1% in 1987-88 to 18.1% in 2014-15. However, imports from OPEC have shot up to 30.6% in 2014-15 on account of the increasing international price of the POL and growing demand in India.
3.The USA occupies second place among individual countries with a share of 13.7% in our exports and 4.9% in our imports. The UK has lost its preeminent position and accounts for only 3% exports and 1.1% imports.
4.Australia, Japan, Switzerland had 2.9% share in our exports and 9.5% in our imports in 2014-15. Whereas they accounted for 12.5% of our exports and 12.9% of our imports in 1987-88. This shows a sharp dip in both imports and exports in relation to these countries. During this period, Latin America witnessed an increase in the volume of exports to 4.7% in 2014-15 and 3.9% in imports during the same period.
Thrust areas
1.Thus, from the above data it is clear that there are ample opportunities for India to expand its exports in Latin American and African countries. Similarly, imports can be increased from African countries. The excessive dependence upon advanced countries of the world has declined. India has further improved its export and import position with Asian countries. The diversified foreign trade is beneficial to India.
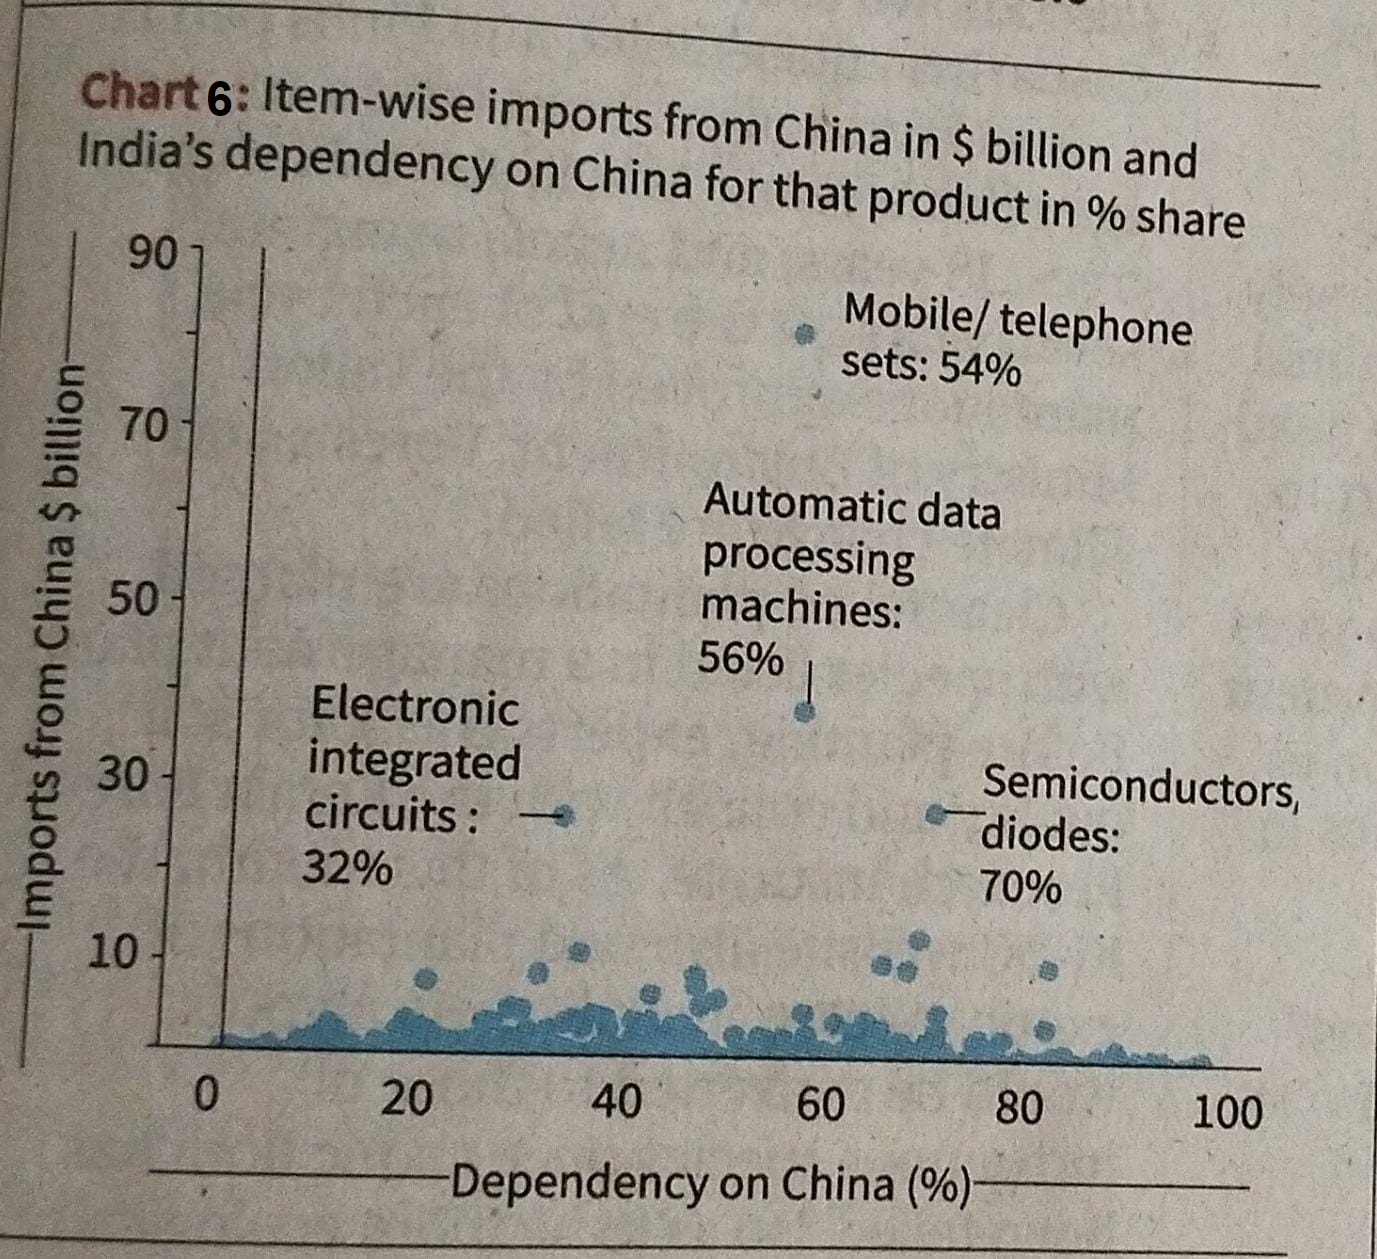
2.However, China once again became the biggest trading partner of India in 2024.
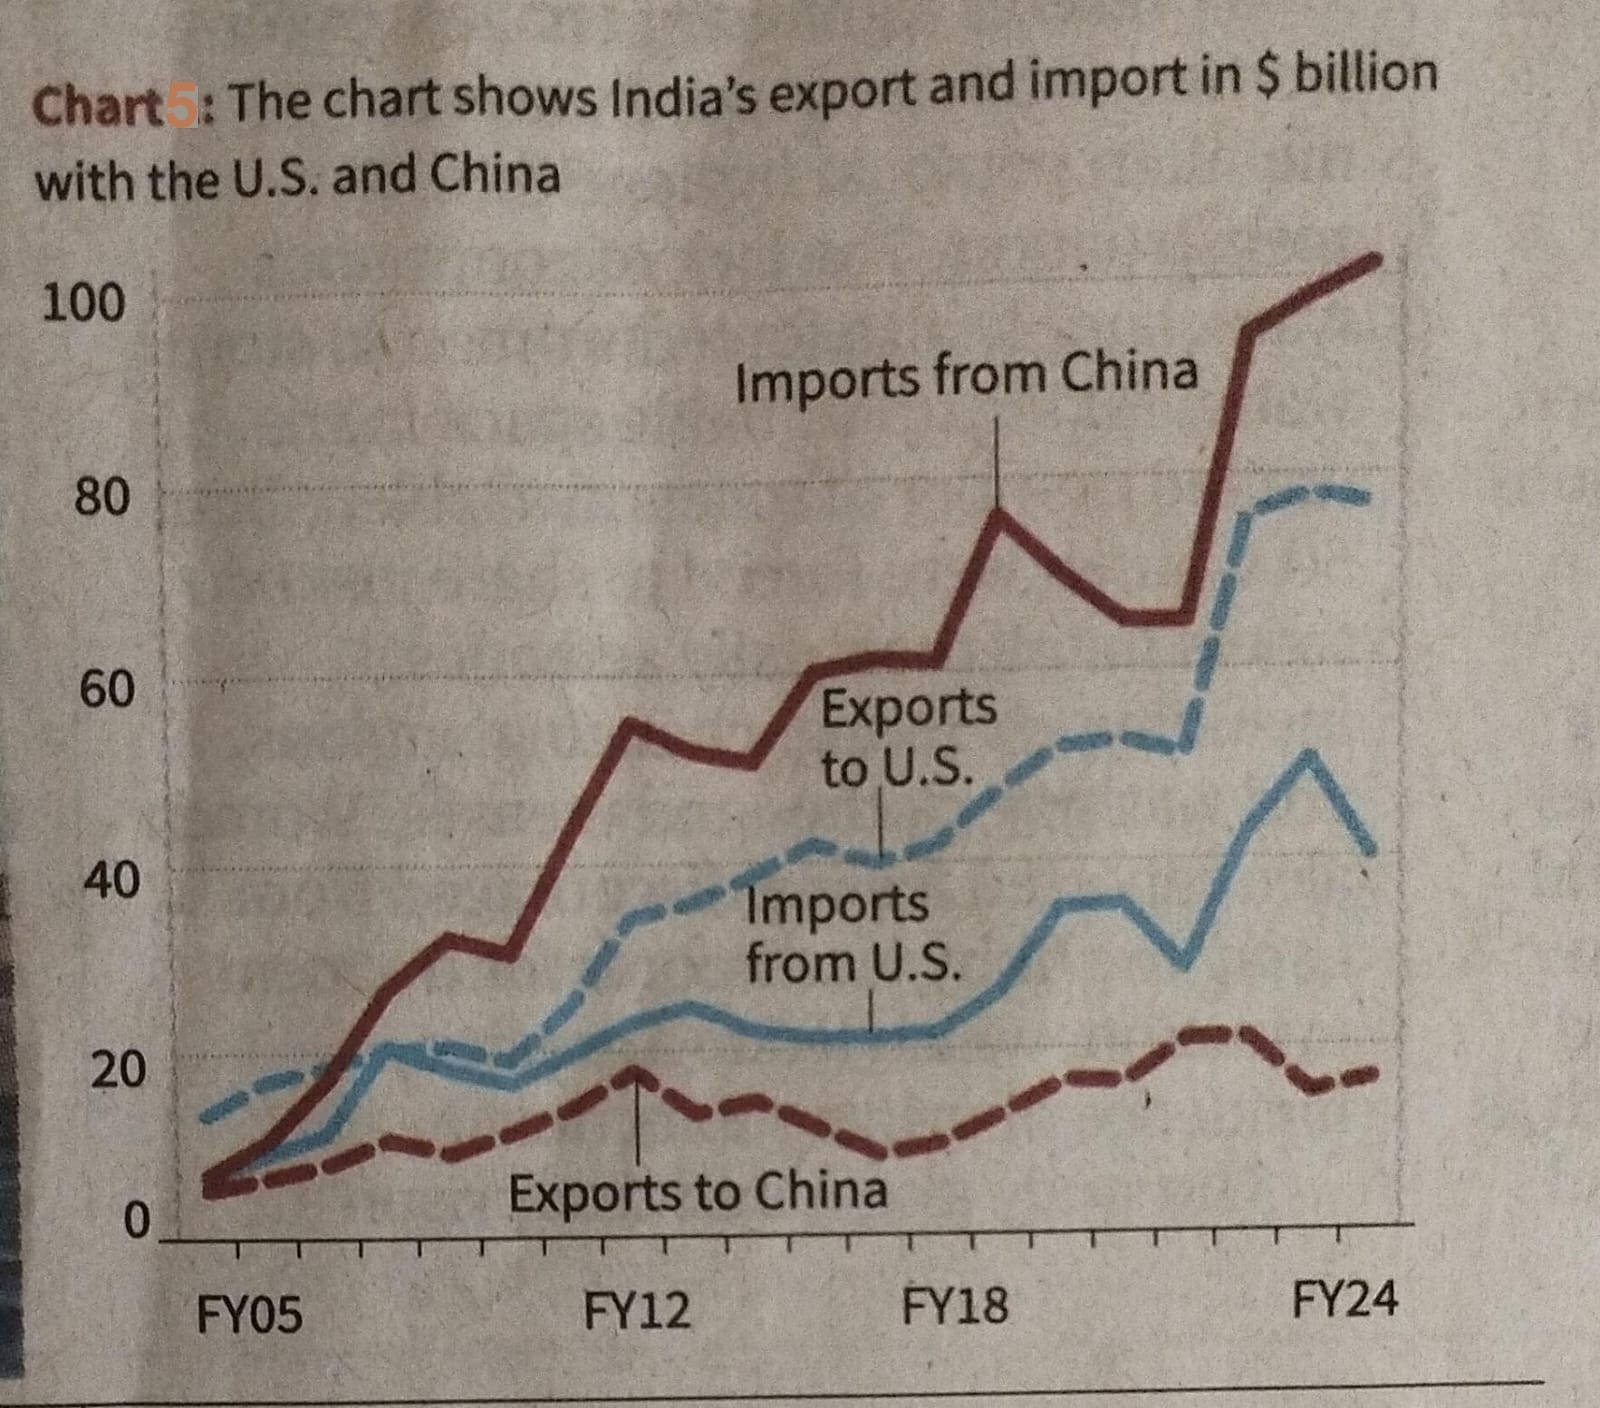
3.The trade relationship with the US is just the opposite. India is exporting more to the US than it is importing. Thus, the trade balance has been widening in recent years. India has a trade surplus of $36.7 Billion.
4.An important feature of India’s foreign trade is that India has a trade deficit with most of the major countries of the world. The trade deficit with Russia has skyrocketed from just $6.6 billion in 2022 to $57.2 billion in 2024 because of the import of oil at a concessional rate from Russia. It has become the chief supplier of POL to India.
5.India’s trade surplus with the Netherlands has increased because of the sanction against Russia by European countries. India refines 40-45% of crude oil imported from Russia and then it sells to the Netherlands which in turn sells POL to other European countries.
Conclusion
1.The composition of India’s foreign trade has undergone substantial changes. The rate of increase in trade was slower in the pre reform period as compared to post reform which registered a higher rate. The growth rate of imports was higher than the growth rate of export, resulting in recurrent trade deficit.
2. India’s major exports now include manufacturing goods such as engineering goods, petroleum products, chemicals and elite products, gems and jewelleries, textiles, electronic goods which constitute over 80% of India’s export basket. It is a remarkable achievement that India has transformed itself from a predominantly primary goods exporting country into a manufacturing and services goods exporting country. India’s dependence on food grain has also declined. Major import items constitute capital goods and intermediates which support the manufacturing sector in order to beat the unfavourable balance of trade in the post reform period, it would be necessary to add new commodities and services at competitive prices in the export basket. It is heartening to note that India’s services trade plus has increased due to a surge in IT exports. But the increase in services is not so much to offset the losses incurred by trade in merchandise.
3.Over the years, India’s direction of trade has undergone substantial change with countries of Asia and Africa. The share of OECD countries, except North America, in India's overall export earnings declined continuously. Developing countries and OPEC emerged as the potential markets for Indian exports. The share of African and Asian developing countries showed an upward trend and these countries have emerged as good markets for Indian exports.
4.Though the volume and value of Indian exports has increased manifold, India’s share in world exports is still far behind China and other developing countries of the world. India’s share of global goods exports was 1.8% in 2023 and imports was 2.8%. Overall trade (merchandise plus services) exports US$770.18 billion and imports US$ 892.18 billion leading to US$ -122 dollar as trade balance.


No comments:
Post a Comment